A Comparison of Power Files of the World Champ On Two Very Different Days
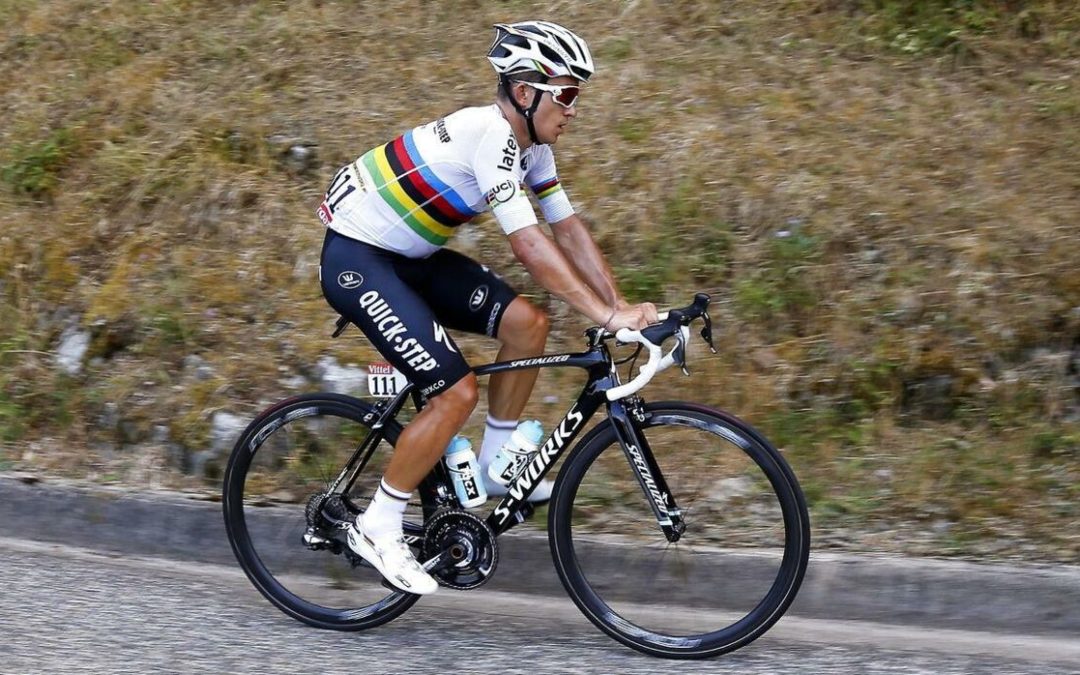
Thanks to Strava and Michal Kwiatkowski we can take a peak at the power profiles of one rider from two similar days with two different strategies during the 2015 Tour de France.
The two stages are:
- Stage 11 – Michal helps Cavendish get over a fairly mountainous route with 6 categorized climbs and 3,619m of climbing
- Stage 12 – he is on the attack all day on a stage with 4,047m uphill and 4 (but harder) categorized climbs
Stage 11 – Looking After Cav
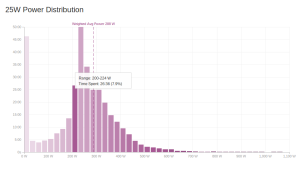
Firstly, on stage 11 we can see he averaged 241w for 5hrs 34mins with a weighted average of 288w. His average heart rate was 141bpm and cadence 85rpm. The day was hot too at 31 degrees C. The major long efforts included: 39mins at 296w, 25mins at 303w, 71mins at 245w, 28mins at 230w, 47mins and a further 31mins both at 236w.
Interestingly Kwiatkowski spent 46mins (13.8%) at 0-24w and 21.4% of the time at less than 150w. Peak power for 30s, 1min, 20mins and 60mins were 782w, 643w, 381w, 348w respectively.
Stage 12 – Up The Road
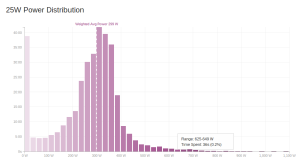
On stage 12 the average power was up to 266w (weighted average 299w) for 5hrs 52mins. Heart rate and cadence were 144bpm and 87rpm respectively, and it was a little cooler at 25 degrees C. The longer efforts on this stage were: 42mins at 324w, 31mins at 336w, 59mins at 296w and 26mins at 357w.
Less time (11%) was spent at 0-24w and 18.3% under 150w. Peak power for 30s, 1min, 20mins and 60mins were 625w, 528w, 364w, 327w respectively.
Conclusion
The main differences can be seen in the sustained long efforts, with significantly higher wattage on these during the breakaway. Peak powers for 30s through to 60mins were actually higher in the “easier” day, supporting Cav. During Stage 12, in the break however, the bulk of the work was done in the mid range and the effort was less polarized.
- Breakaways tend to require much more even distribution of power compared to being in the bunch as the goal is to sustain a good pace throughout.
- The bunch can often have extreme contrasts of short, hard efforts interspersed with periods of easy cruising.
- These can be seen in the power distribution graphs


